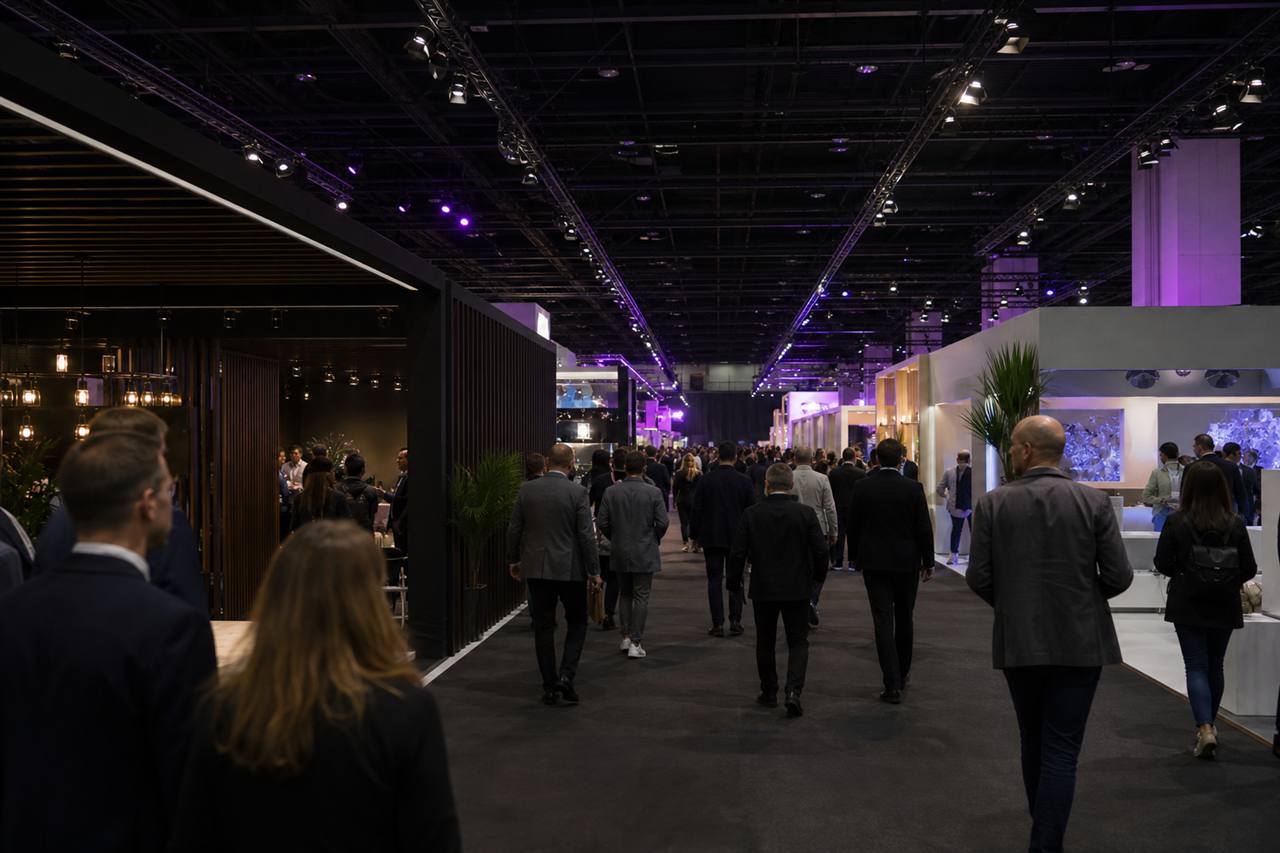
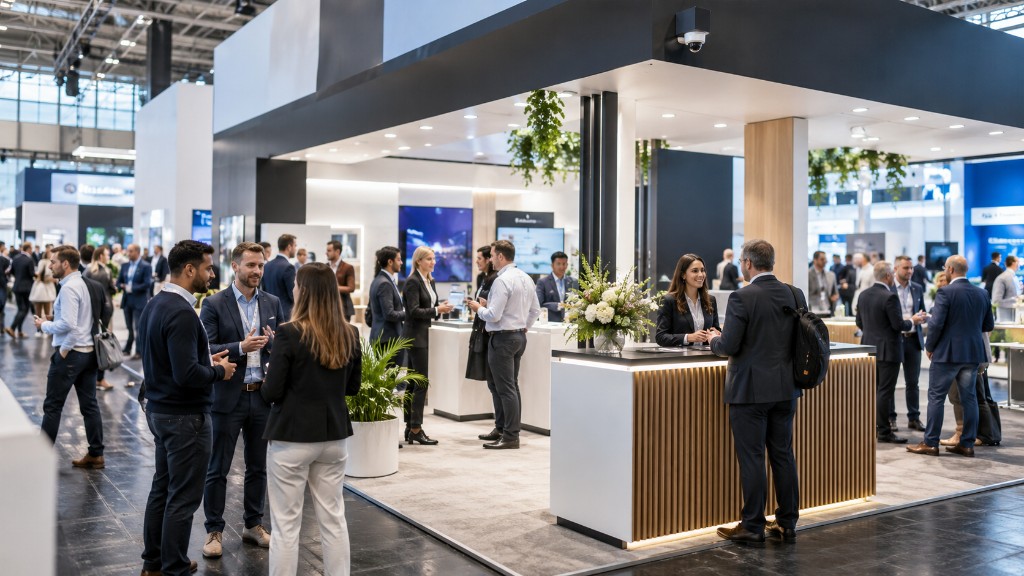
Traditional event reporting
- Badge scans
- Leads
- Meetings
- Staff feedback
Event Visitor Analytics
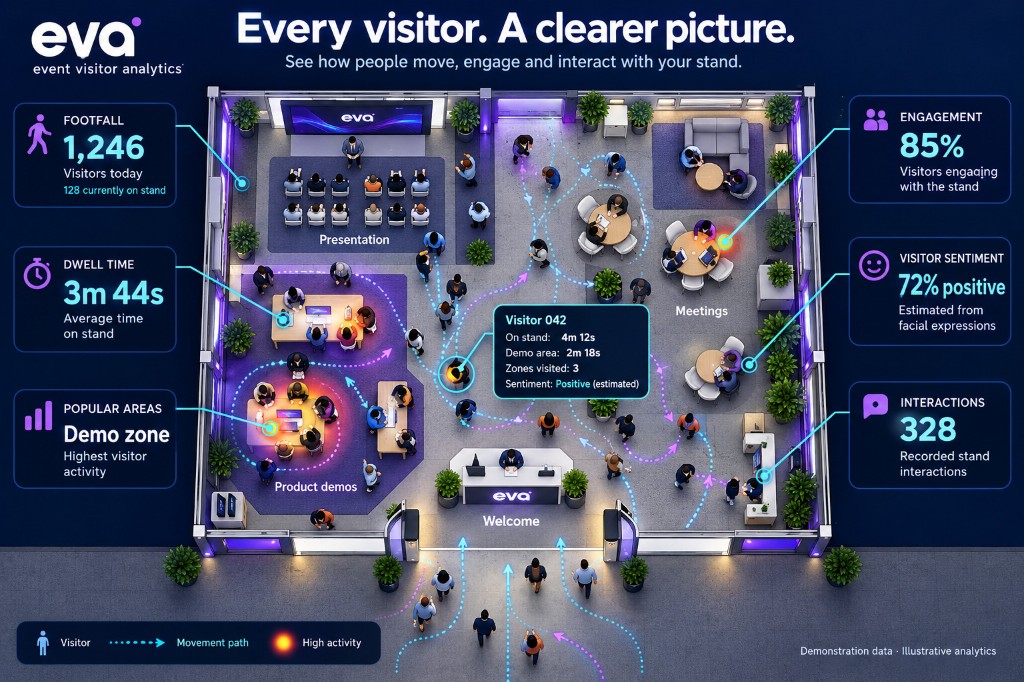
EVA transforms activity across your exhibition stand into real-time visitor intelligence - helping you understand engagement, dwell time, interactions and performance.
Exhibitors know how many people became leads. They often don't know who passed the stand, who stopped, who stayed, or what to change next time. Badge scans, meetings and staff feedback only describe a fraction of the event.
EVA turns them into intelligence.
Meet EVA
Visitors
Illustrative sample data
Engagement
Illustrative sample data
Emotion
Illustrative sample data
Interaction
Illustrative sample data
Turning footfall into intelligence.
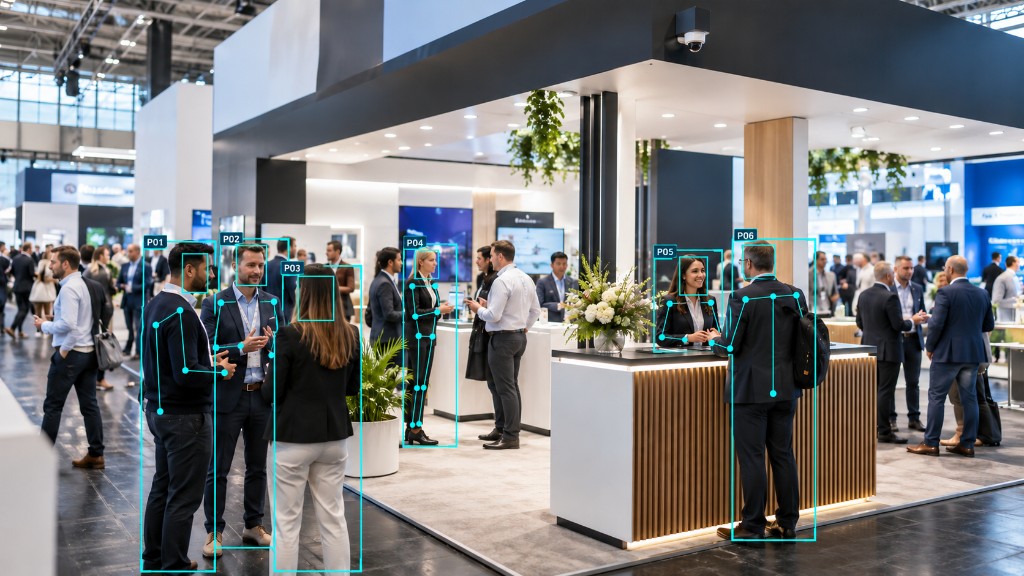
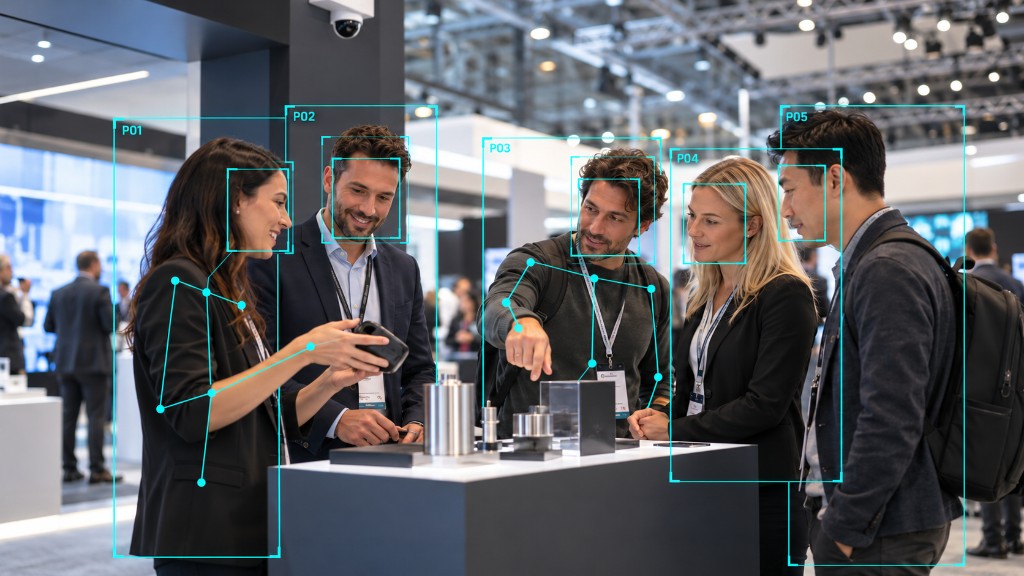
Cameras observe activity across configured event areas.
Entering, leaving, product interactions and staff interactions are recorded as activity.
Visitor count, dwell time, engagement, product interaction, repeat visits, heatmaps, staff interaction and sentiment.
EVA's processing and AI layer analyses event activity.
Insights are presented through the EVA dashboard.
Use event intelligence to understand performance and inform future decisions.
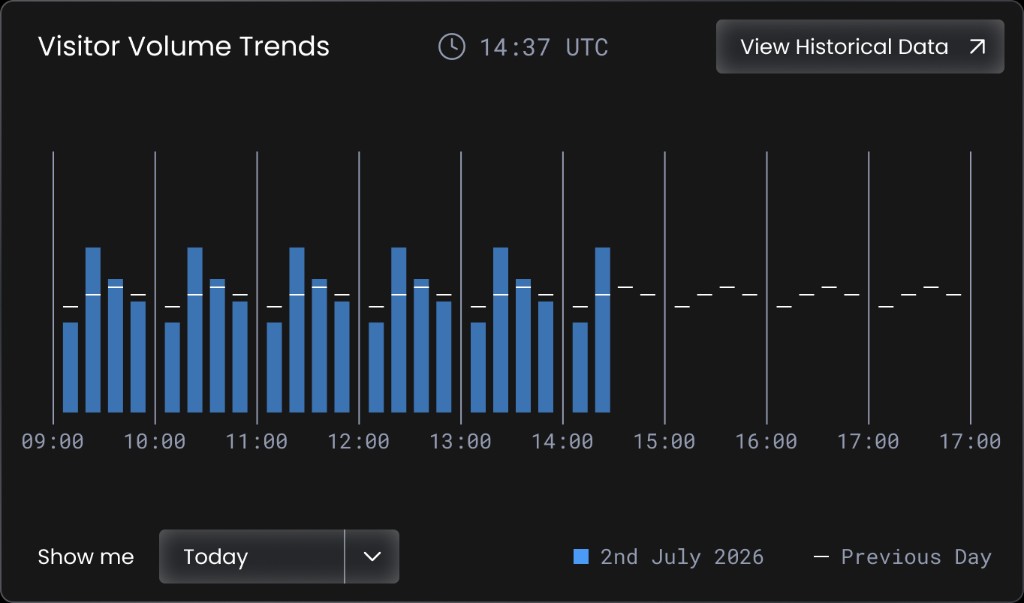
During an exhibition, EVA can surface live analytics so teams can see visitor volume, dwell and engagement as the event unfolds - including when the stand fills and clears, hour by hour. Figures shown here are illustrative marketing data, not client results.
Coverage
EVA gathers what happened on the stand into measures you can report: who passed, who entered, where they stayed, and how that changed through the day.
How many people passed, entered, and never came in.
Which areas held people and which they walked through.
Which demos, products and experiences actually stopped visitors.
When the stand fills and clears, so staffing can follow the crowd.
Measure this event on the same basis as the last one.
See how aisle traffic converts into entry, dwell and interaction.
The EVA dashboard brings visitor activity together in one place - during the event and afterwards - so performance is no longer reconstructed from badge scans and anecdotes.
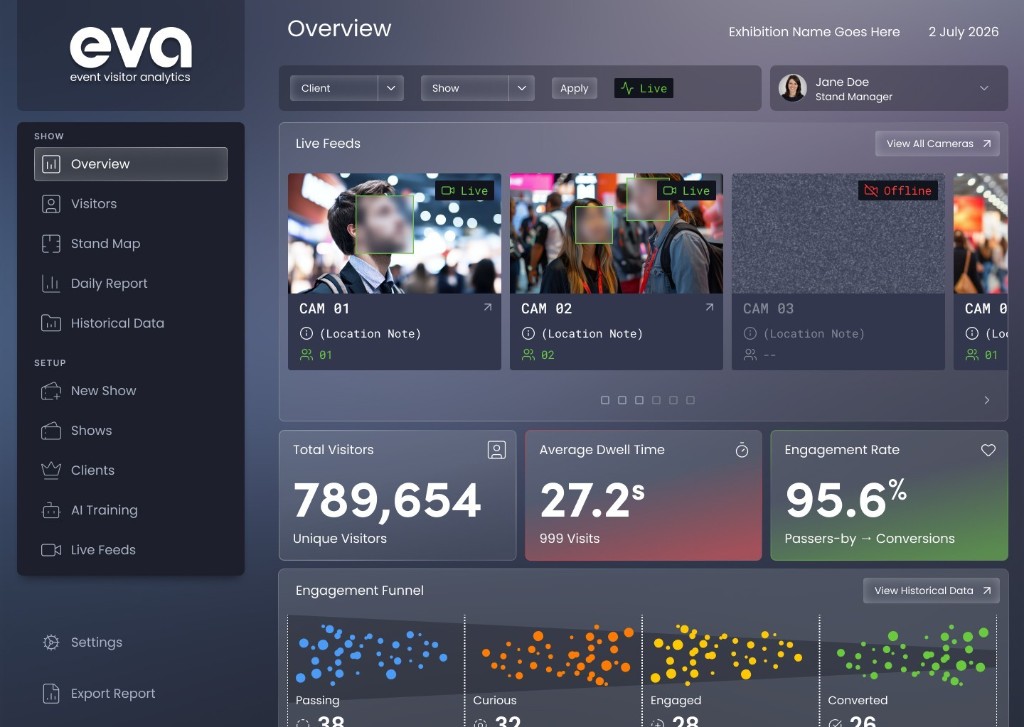
See visitor volume, dwell and engagement while the exhibition is still open.
A stakeholder view of what happened on the stand, not only who became a lead.
Take visitor, dwell and zone measures into your own analysis alongside leads and spend.
Platform capabilities
See visitor volume, dwell and engagement while the exhibition is still open.
See when the stand fills and clears so staffing and demo times can follow the crowd.
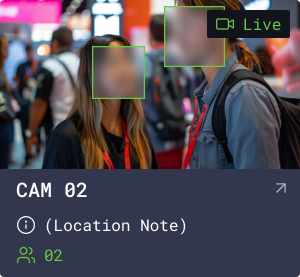
Review configured live feeds alongside the analytics they inform.
Understand how many people entered the stand, not only how many became leads.
Measure how many people passed the stand, not only how many stepped in.
Distinguish repeat movement from unique visits across the event, without identifying who anyone is.
Measure how long visitors stay - on the stand and in specific zones.
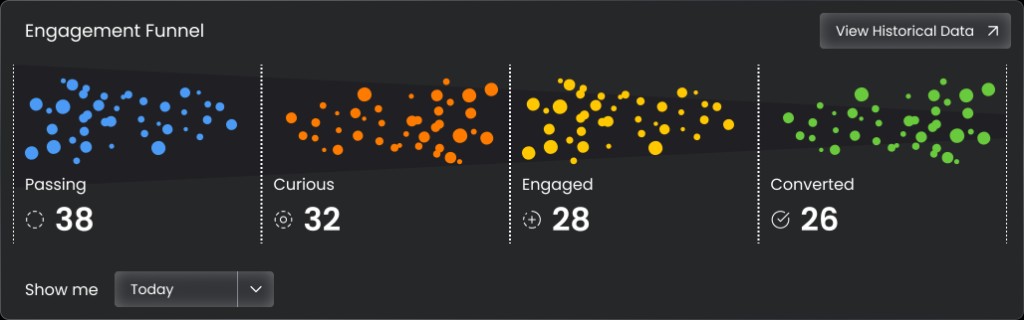
See how passer-by traffic converts into entry, attention and interaction.
Follow anonymous visitor movement across configured areas of the stand, without attaching an identity.
Reconstruct how an anonymous visit moves from entry to product zones, staff and exit.
Understand when and where visitors engage with the team.
Compare days, layouts, exhibitions and campaigns with the same measures.
Define the products, demos and zones you need to understand.
See which parts of the stand attract attention and which stay cold.
Visualise the routes visitors actually take through the space.
Measure interest in products and demonstrations, beyond a scanned badge.
See who returns to the stand later in the day or later in the show.
Review aggregated emotional sentiment where it has been configured.
Turn the event into a report stakeholders can use to decide what happens next.
Take visitor, dwell and zone measures into your own analysis alongside leads and spend.
Anonymous visitor journeys show how people move through the stand: where they enter, what they engage with, and how long they stay. A journey is one visit, not a person, and it ends when they leave.
Visitor 0284 · Dwell 12m 14s · Engagement High
Demonstrative data. Anonymous visitor identifier.
EVA helps exhibitors understand how different parts of a stand perform - hot zones, cold zones, visitor routes and points of interest - so layout and product placement can be improved.
Compare exhibitions, event days, stand layouts, locations, products, campaigns and experiences on the same definitions of visitors, dwell and engagement. Sample figures below illustrate the kind of comparison EVA is designed to support.
Sample data for illustration only.
Next event
The value is not a chart. It is a decision you can take into the next hour, the next day, or the next show. Examples below use illustrative sample data, not client results.
Sample observations for illustration only.
Operations
Layout
Reporting
Outcomes
Understand which zones attract attention and which are ignored.
Understand what makes visitors stay longer.
Bring measurable data to exhibition investment.
Understand when and where staff interactions happen.
Use historical intelligence to make better decisions.
Give stakeholders measurable evidence of event activity.
Solutions
Exhibitors
Turn exhibition investment into visitor intelligence you can take into the next event.
Explore this solutionStand builders
Show them how the stand performed - flow, dwell, hot zones and engagement.
Explore this solutionEvent agencies
Give campaigns a layer of footfall, participation and interaction analytics.
Explore this solutionEvent organisers
See how visitors move and engage across physical event environments.
Explore this solutionTechnology
Cameras are placed to work with the stand, not dominate it. Where existing cameras already cover the space, EVA can use those feeds if angle and quality allow. Activity can be processed locally where required, then turned into analytics rather than named identities.
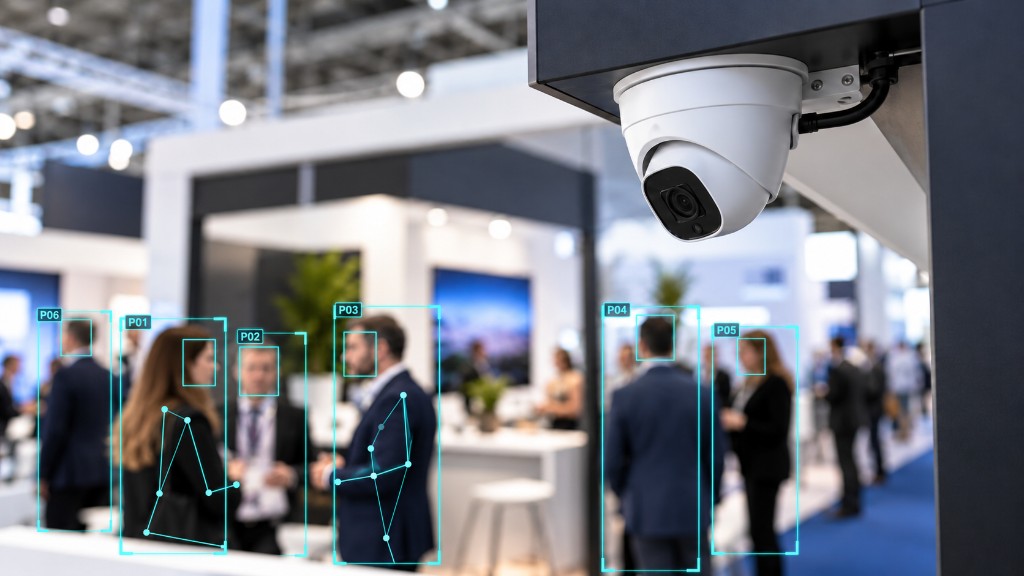
Capture activity across configured stand and event areas. Existing cameras can be used where angle, resolution and connectivity allow.
Connect capture hardware around the stand.
Provide secure connectivity from the event environment.
Process activity locally where required, so the dashboard receives analytics rather than a feed of named individuals.
Store and serve event intelligence securely. This is analytics about the stand, not a store of people.
Turn processed activity into dashboards and reports.
Insights
Visitor count is not a report. The useful picture is who passed, who entered, where they stayed, and what that tells you to change.
Read insightDigital channels are instrumented. Exhibitions often are not. Visitor analytics is how physical events join the same conversation.
Read insightOne event tells you what happened. A consistent measurement model tells you what to do next.
Read insightEVA helps you capture it, understand it and turn it into better decisions.